

Data Selfie - Data Visualization
︎ 2021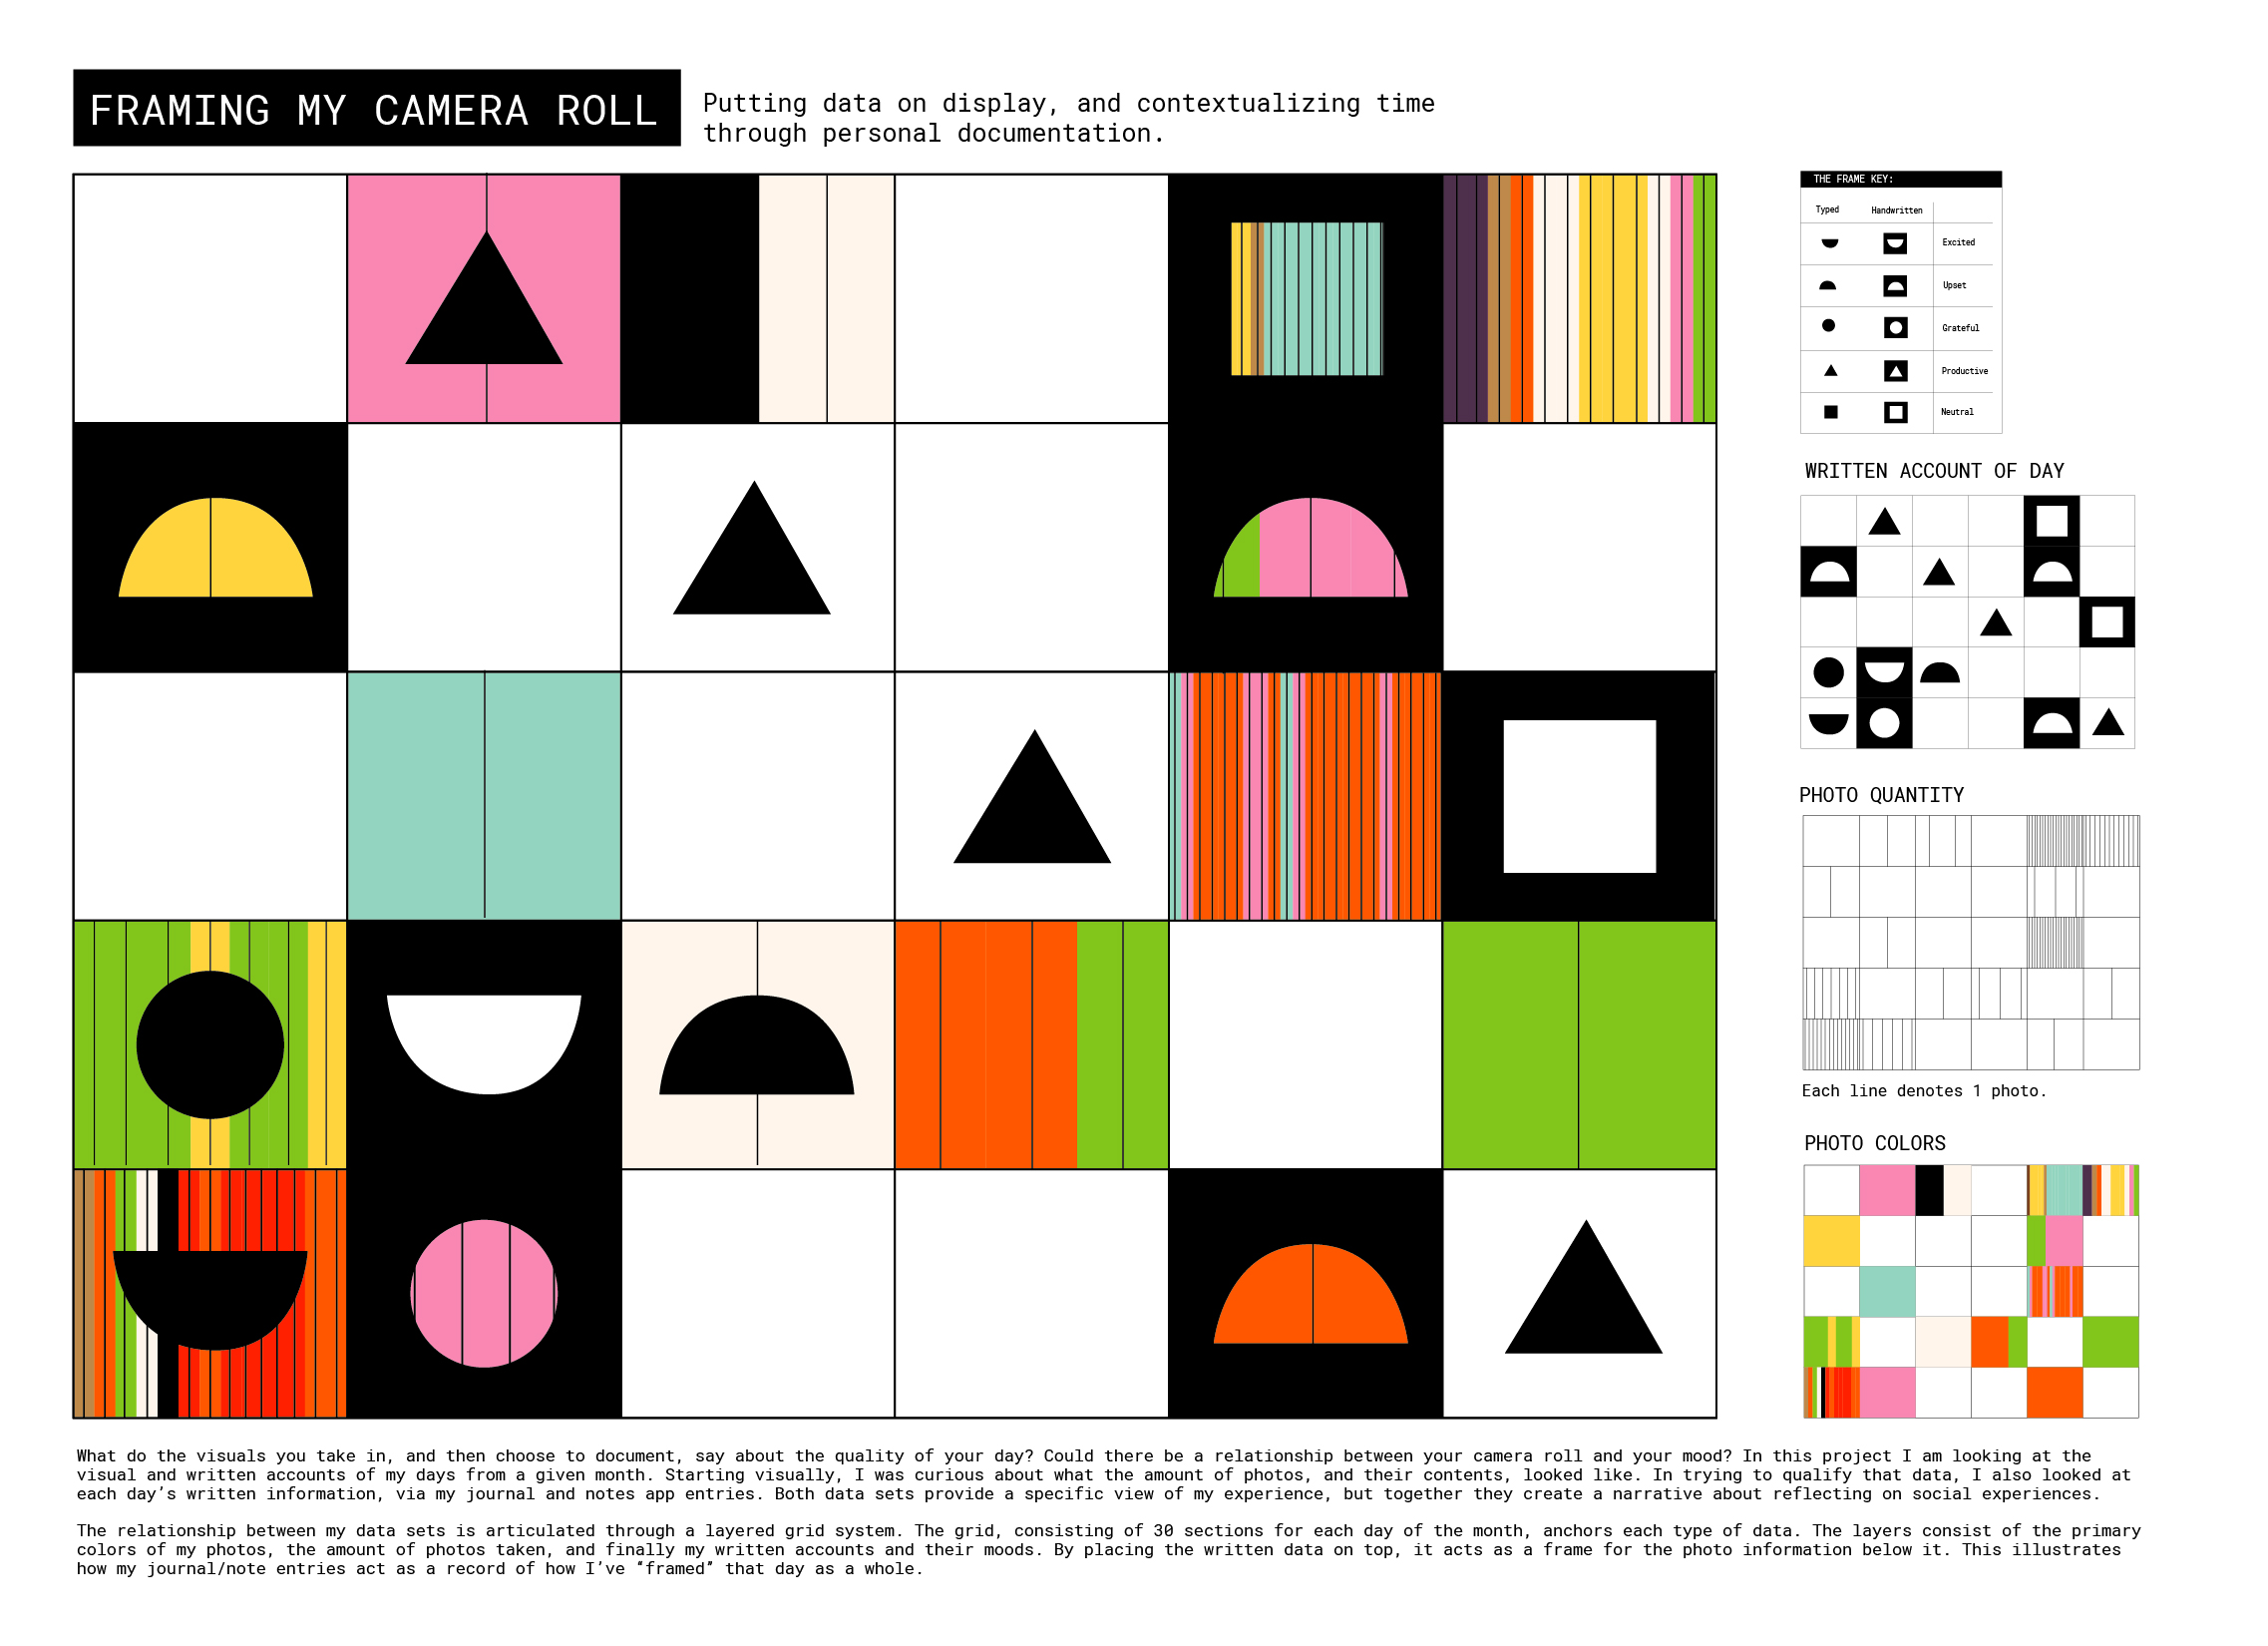
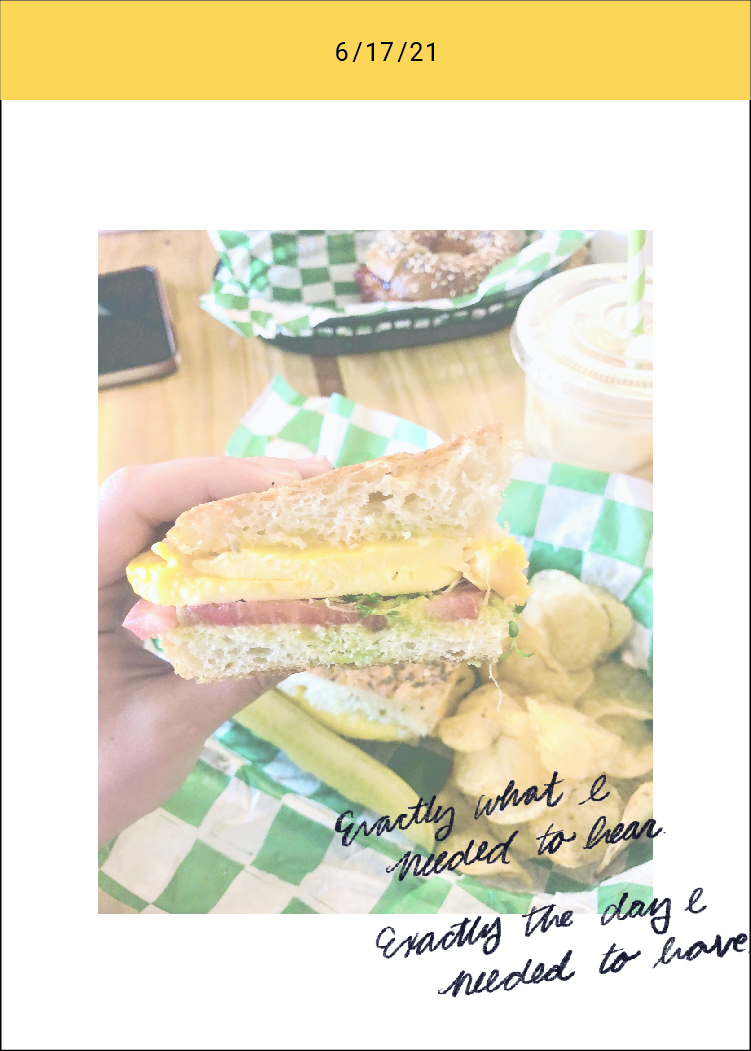
What do the visuals you take in and then choose to document, say about the quality of your day? Could there be a relationship between your camera roll and your mood? In this project, I am looking at the visual and written accounts of my days from a given month. Starting visually, I was curious about what the number of photos, and their contents, looked like. In trying to qualify that data, I also looked at each day’s written information, via my journal and Notes app entries. Both data sets provide a specific view of my experience, but together they create a narrative about reflecting on social experiences.

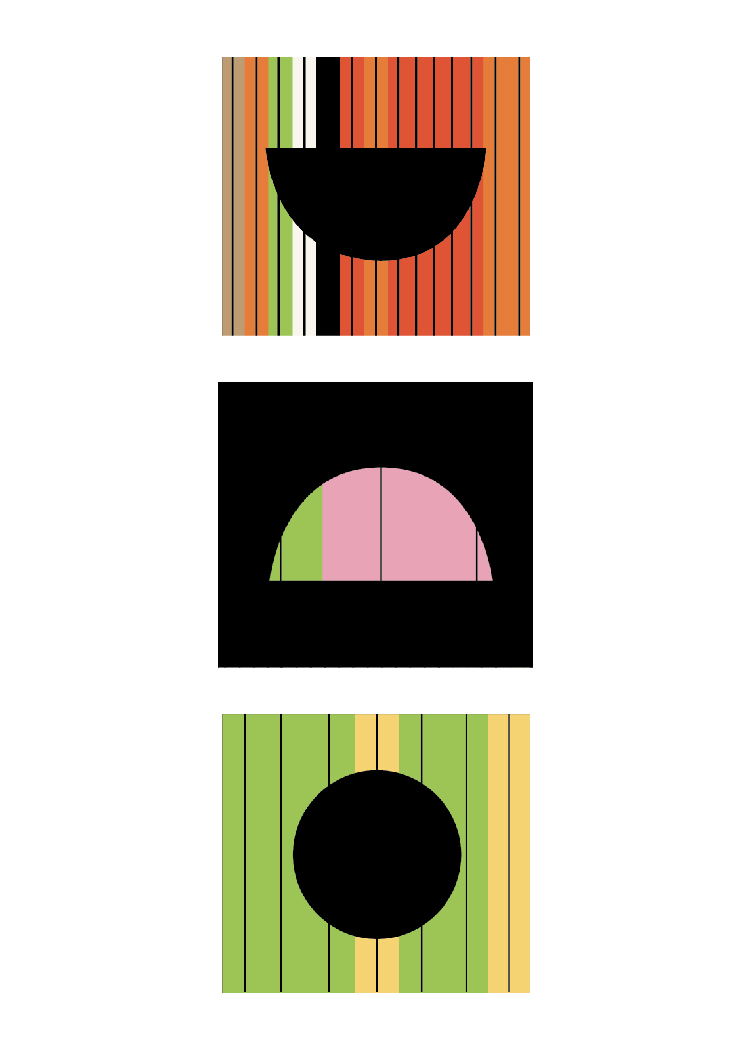
After sketching mutliple approaches, I chose to articulate the relationship between my data sets through a layered grid system. The grid, consisting of 30 sections for each day of the month, anchors each type of data. The layers consist of the primary colors of my photos, the number of photos taken, and finally my written accounts and their moods. By placing the written data on top, it acts as a frame for the photo information below it. This illustrates how my journal/note entries act as a record of how I’ve “framed” that day as a whole.

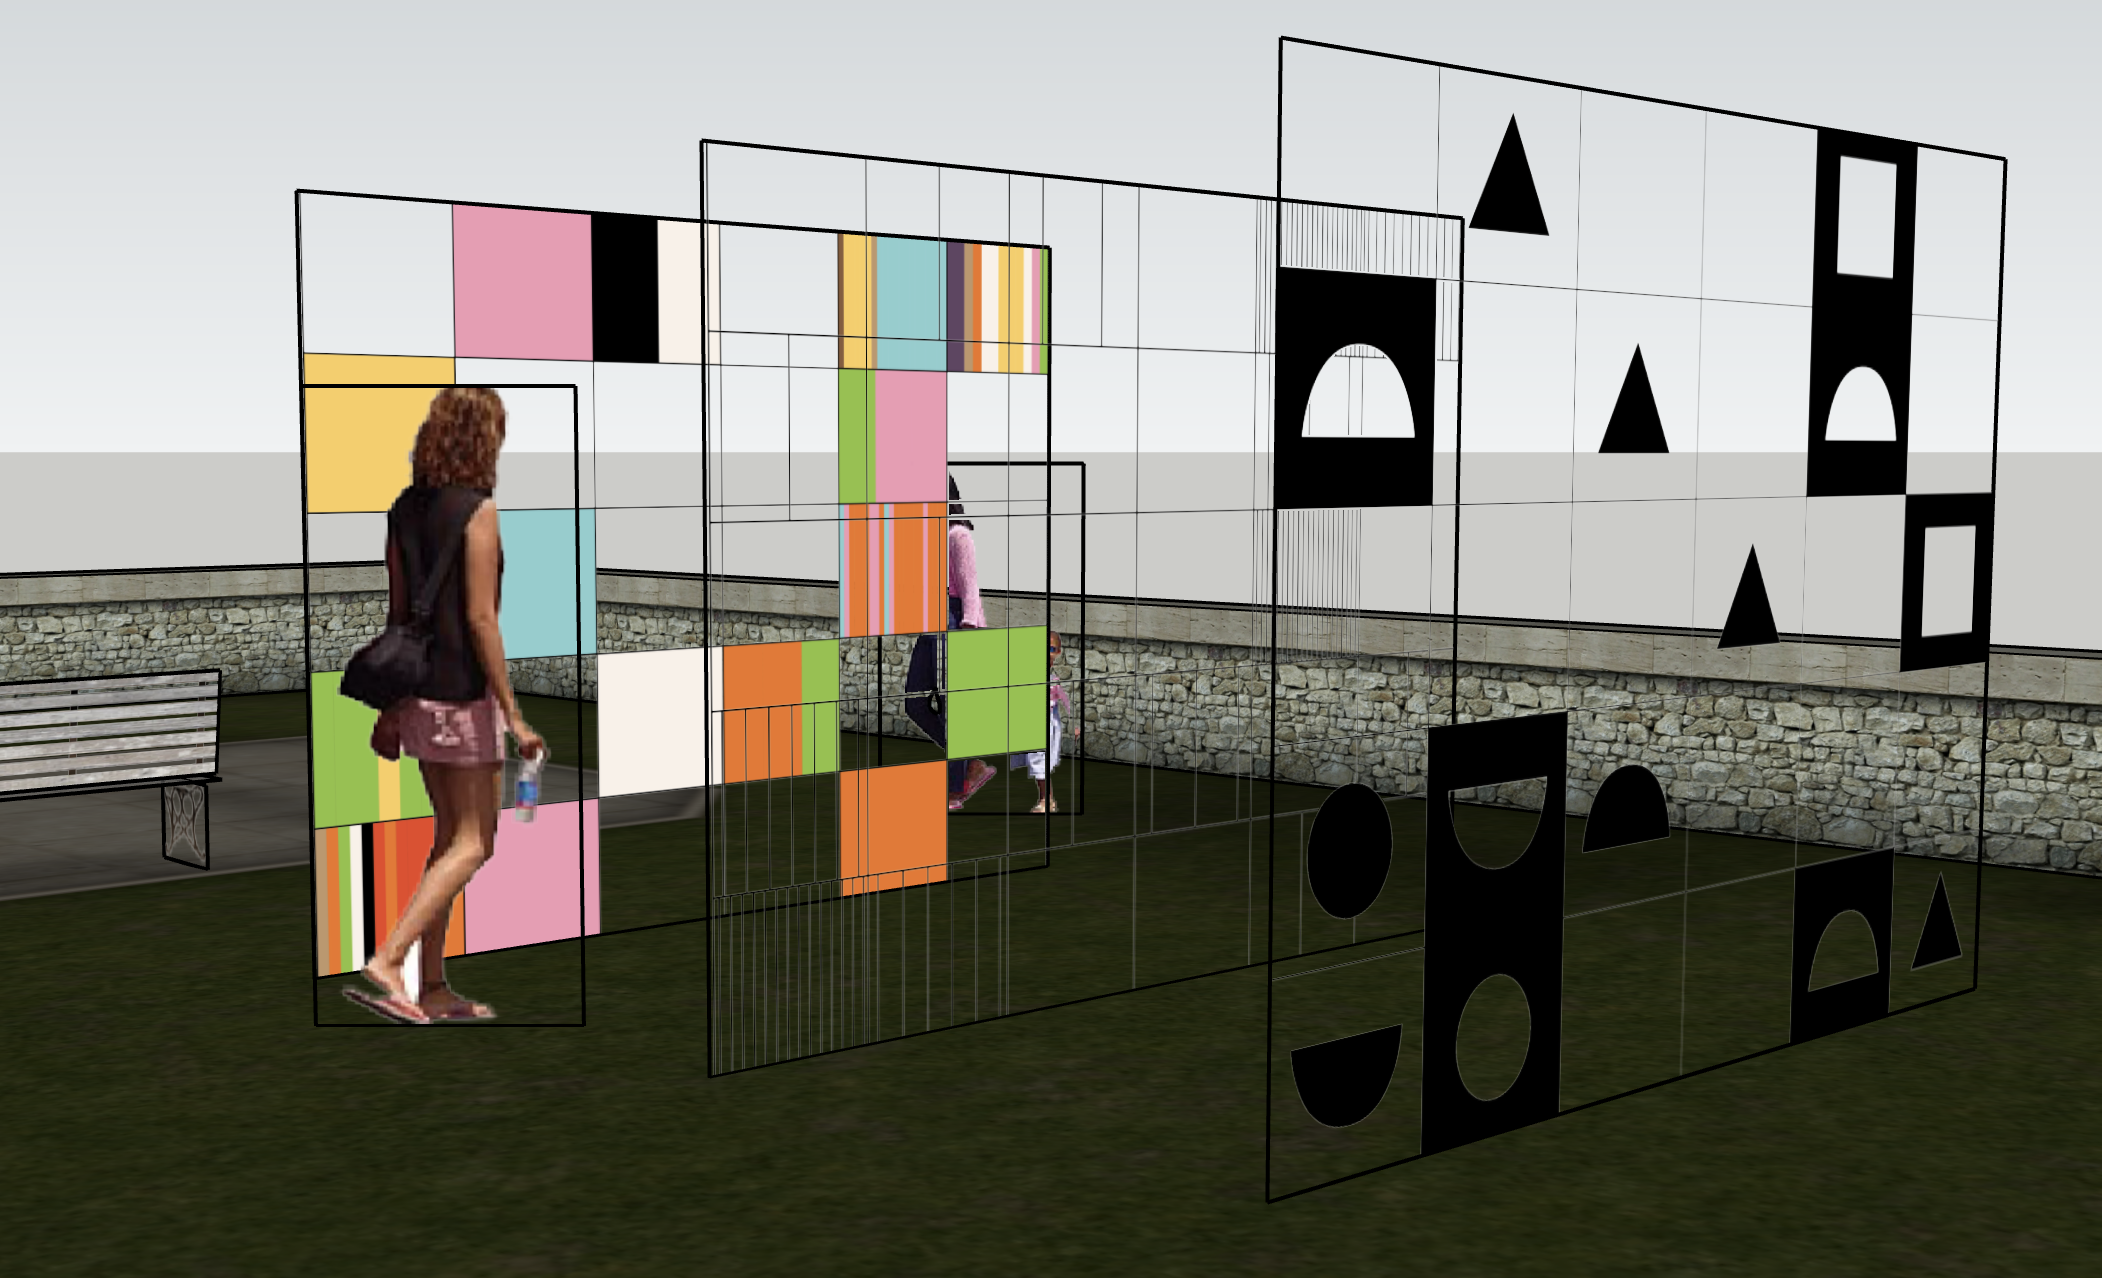
In my first exploration of the 3-D modeling software SketchUp, I built a mockup of how this data installation could look in a public space. Each layer of the grid would be given its own plane, lined up with around 1.5 yards between them. In theory, from the right spot, you could stand back far enough and see how the layers come together to become the full data visualization. However, the spacing between each plane, which would allow for walking in between the layers, would offset and slightly obscure the visualization that occurred when the layers were compressed. Conceptually this speaks to how impossible it becomes to truly see how someone else experiences their own life.
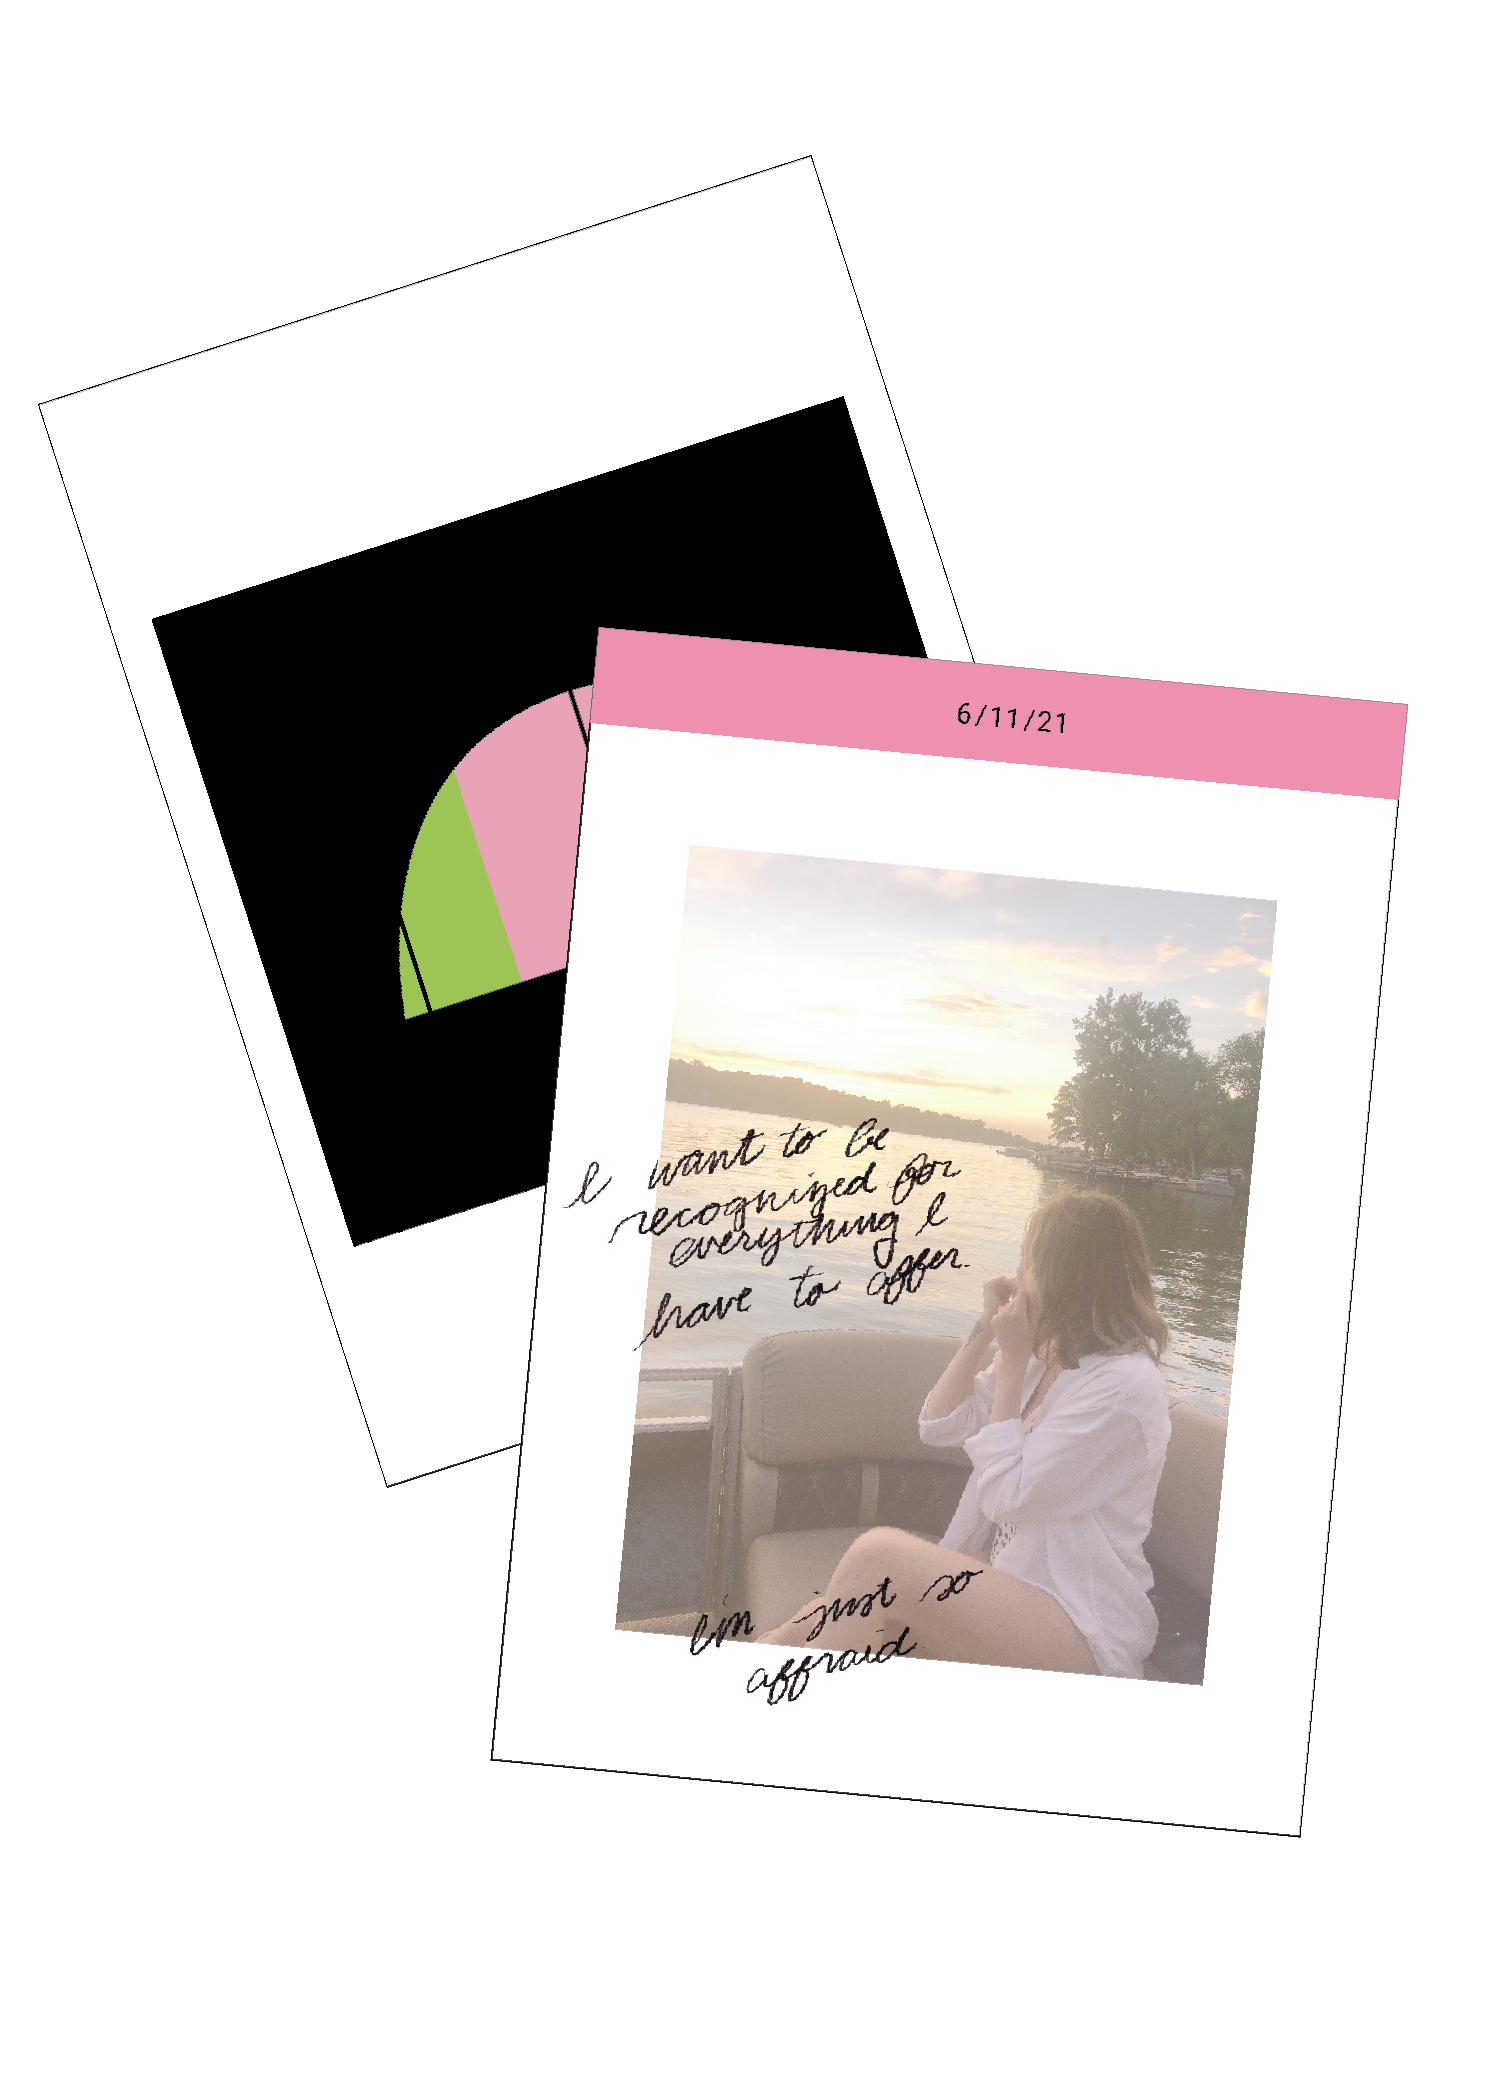
To give context to the installation, I also included an accompanying placard. This would show my initial version of the visualization, and also extend an invitation for interaction. Along with related instructions, it would have a pocket for small cards, each representative of one tile of the layered grid.

“In doing this data collection and visualization, I found myself asking many questions about the way I frame my day for the viewing of others. Social media culture promotes the filtering of content you share, seemingly the less vulnerable the better. My posts hardly ever honor the feelings expressed in my journal entries, and they also use the most curated photos of the day.
In the spirit of vulnerability, I invite you to engage in an exercise that will give you a chance to understand the art on a more personal level. To the right, there are cards that correspond with a single section of the grid. Please choose a card and then move around the installation, try and identify what parts of the structures made up the day visualized on your card. In physically exploring the space, you are engaging with my data in a new and active way, framing it as an opportunity for discovery.
On the reverse side of the card, there will be a specific photo from the given day, and in some cases, an excerpt from my own written accounts. Sharing details of this level feel personally vulnerable and free of the filters that social media places on the way we present our days. I hope to reinvigorate the act of personal sharing, and encourage more transparency about how we are actually experiencing and framing our own lives.”
 .
. 
︎︎︎ Return to Design Work Gallery